query_cells()
Query cell data for multiple cells.
For temporal datasets, automatically sweeps all time points unless time_value is specified. For static datasets, returns values directly.
Parameters
cell_ids(list[int]) — The cell IDs to query.block_names(list[str] | str | None, default:None) — Block names for MultiBlock meshes. Ifstr, applies to all cells. Iflist, must match length ofcell_ids. Must beNonefor single-block meshes.time_value(float | None, default:None) — Query a specific time value instead of sweeping all time points. Ignored for static datasets.
Returns
Returns a list of dictionaries, one per cell ID. Each dictionary has the same structure as query_cell.
[
    {  # cell_ids[0]
        "scalar_name": {"time": [...], "value": [...]},
        "vector_name": {"time": [...], "x_value": [...], "y_value": [...], "z_value": [...]},
        ...
    },
    {  # cell_ids[1]
        ...
    },
    ...
]
Examples
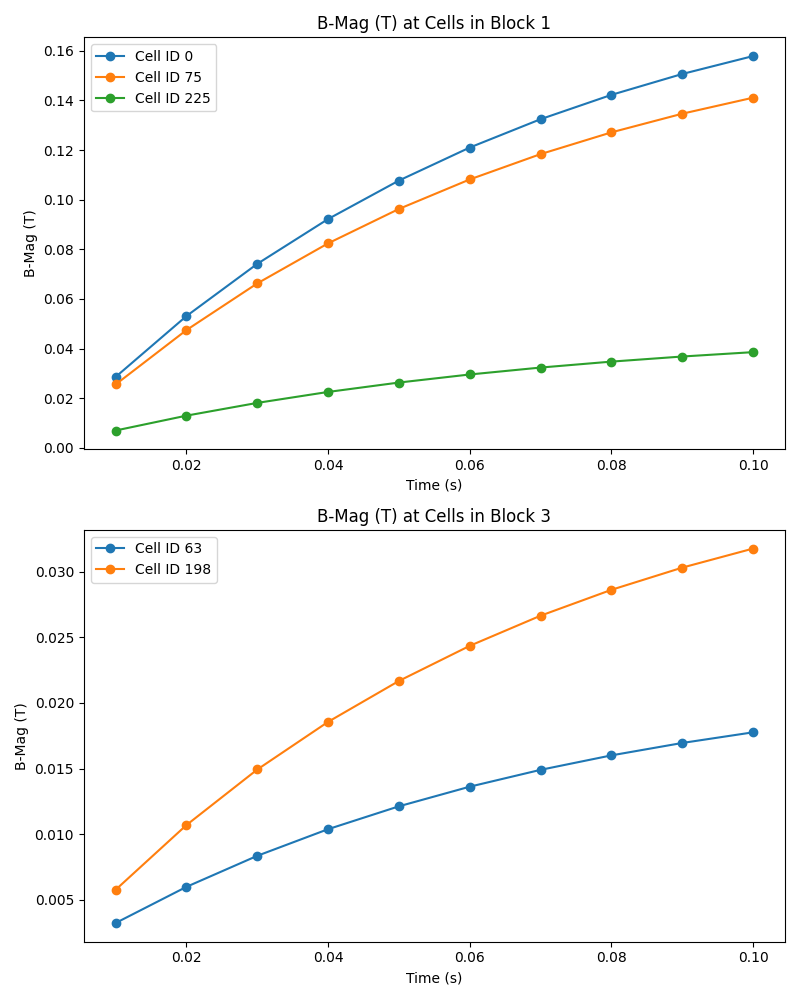
Sweep all time steps
from pyemsi import Plotter, examples
from matplotlib import pyplot

file_path = examples.transient_path()
plt = Plotter(file_path)
data = plt.query_cells(cell_ids=[0, 75, 225, 63, 198], block_names=["1", "1", "1", "3", "3"])

fig, axes = pyplot.subplots(2, 1, figsize=(8, 10))

# Block 1
axes[0].plot(data[0]["B-Mag (T)"]["time"], data[0]["B-Mag (T)"]["value"], marker="o", label="Cell ID 0")
axes[0].plot(data[1]["B-Mag (T)"]["time"], data[1]["B-Mag (T)"]["value"], marker="o", label="Cell ID 75")
axes[0].plot(data[2]["B-Mag (T)"]["time"], data[2]["B-Mag (T)"]["value"], marker="o", label="Cell ID 225")
axes[0].set_xlabel("Time (s)")
axes[0].set_ylabel("B-Mag (T)")
axes[0].set_title("B-Mag (T) at Cells in Block 1")
axes[0].legend()

# Block 3
axes[1].plot(data[3]["B-Mag (T)"]["time"], data[3]["B-Mag (T)"]["value"], marker="o", label="Cell ID 63")
axes[1].plot(data[4]["B-Mag (T)"]["time"], data[4]["B-Mag (T)"]["value"], marker="o", label="Cell ID 198")
axes[1].set_xlabel("Time (s)")
axes[1].set_ylabel("B-Mag (T)")
axes[1].set_title("B-Mag (T) at Cells in Block 3")
axes[1].legend()

fig.tight_layout()
fig.savefig("docs/static/demos/query_cells.png")
Query a single time value
from pyemsi import Plotter, examples

file_path = examples.transient_path()
plt = Plotter(file_path)

# Use time_point_value() to look up the time value for a given index
t = plt.time_point_value(4)   # 0.05  (5th time step, zero-based)

# Query only at that time value instead of sweeping all time steps
results = plt.query_cells(cell_ids=[0, 75, 225], block_names="1", time_value=t)

# Each result has single-element time/value lists
print(results[0]["B-Mag (T)"]["time"])   # [0.05]
print(results[0]["B-Mag (T)"]["value"])  # [0.10771600157022476]
print(results[1]["B-Mag (T)"]["value"])  # [0.09627089649438858]
print(results[2]["B-Mag (T)"]["value"])  # [0.026306699961423874]
See Also
query_cell— Query a single cellquery_points— Query multiple pointsmesh— Access the underlying mesh- PyVista DataSetAttributes