sample_point()
Sample mesh data at a single point coordinate.
This method creates a probe at the specified 3D coordinate and samples the mesh data onto it using PyVista's sample() filter. For temporal datasets, automatically sweeps all time points unless time_value is specified. For static datasets, returns values directly.
Parameters
point(Sequence[float]) — 3D coordinate[x, y, z]to sample at.time_value(float | None, default:None) — Query a specific time value instead of sweeping all time points. Ignored for static datasets.tolerance(float | None, default:None) — Tolerance for the sample operation. IfNone, PyVista generates a tolerance automatically.
Returns
Returns a dictionary with array names as keys. Both static and temporal datasets use the same structure, with static datasets using time: [0]. Each dictionary includes a "coordinates" key with the probe position.
# Scalars:
{
    "scalar_name": {
        "time": [0.0, 0.001, 0.002, ...],  # [0] for static
        "value": [val0, val1, val2, ...]
    },
    "coordinates": {
        "x": 1.0,
        "y": 2.0,
        "z": 3.0
    },
    ...
}

# Vectors (3-component):
{
    "vector_name": {
        "time": [0.0, 0.001, 0.002, ...],  # [0] for static
        "x_value": [x0, x1, x2, ...],
        "y_value": [y0, y1, y2, ...],
        "z_value": [z0, z1, z2, ...]
    },
    "coordinates": {
        "x": 1.0,
        "y": 2.0,
        "z": 3.0
    },
    ...
}
Examples
Sweep all time steps
from pyemsi import Plotter, examples
from matplotlib import pyplot
file_path = examples.transient_path()
plt = Plotter(file_path)
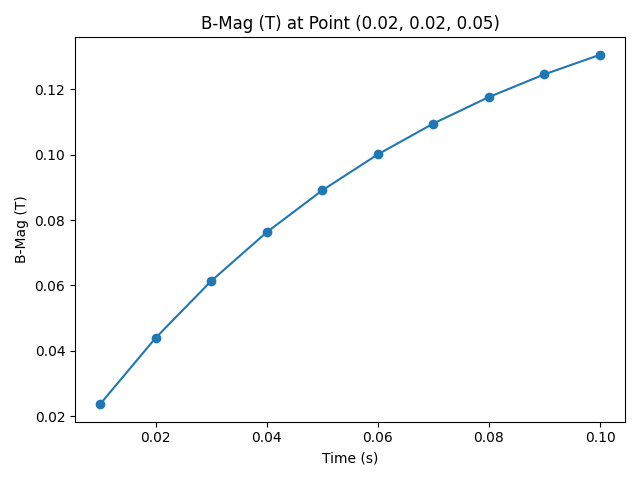
data = plt.sample_point((0.02, 0.02, 0.05))
fig, ax = pyplot.subplots()
ax.plot(data["B-Mag (T)"]["time"], data["B-Mag (T)"]["value"], marker="o")
ax.set_xlabel("Time (s)")
ax.set_ylabel("B-Mag (T)")
ax.set_title("B-Mag (T) at Point (0.02, 0.02, 0.05)")
fig.tight_layout()
fig.savefig("docs/static/demos/sample_point.png")
Query a single time value
from pyemsi import Plotter, examples

file_path = examples.transient_path()
plt = Plotter(file_path)

# Use time_point_value() to look up the time value for a given index
t = plt.time_point_value(4)   # 0.05  (5th time step, zero-based)

# Sample only at that time value instead of sweeping all time steps
data = plt.sample_point((0.02, 0.02, 0.05), time_value=t)

print(data["B-Mag (T)"]["time"])   # [0.05]
print(data["B-Mag (T)"]["value"])  # [0.08909410238265991]
See Also
sample_points()— Sample at multiple point coordinatessample_line()— Sample along a straight linequery_point()— Query data by point ID (indexed access)