sample_points()
Sample mesh data at multiple point coordinates (point cloud).
This method creates a point cloud probe from the specified coordinates and samples the mesh data onto each point. For temporal datasets, automatically sweeps all time points unless time_value is specified. For static datasets, returns values directly.
-
points(Sequence[Sequence[float]]) — List of 3D coordinates[[x, y, z], ...]to sample at. -
time_value(float | None, default:None) — Query a specific time value instead of sweeping all time points. Ignored for static datasets. -
tolerance(float | None, default:None) — Tolerance for the sample operation. IfNone, PyVista generates a tolerance automatically. -
progress_callback(callable | None, default:None) — Callback function for progress updates during temporal sweeps. Called with(current, total). Should returnTrueto continue orFalseto cancel.
Returns a list of dictionaries (one per point) with array names as keys. Each dictionary includes a "coordinates" key with the probe position.
[
    {
        "scalar_name": {
            "time": [0.0, 0.001, 0.002, ...],
            "value": [val0, val1, val2, ...]
        },
        "coordinates": {"x": 1.0, "y": 2.0, "z": 3.0},
        ...
    },
    {
        "scalar_name": {
            "time": [0.0, 0.001, 0.002, ...],
            "value": [val0, val1, val2, ...]
        },
        "coordinates": {"x": 4.0, "y": 5.0, "z": 6.0},
        ...
    },
    ...
]
Examples
Sweep all time steps
from pyemsi import Plotter, examples
from matplotlib import pyplot
file_path = examples.transient_path()
plt = Plotter(file_path)
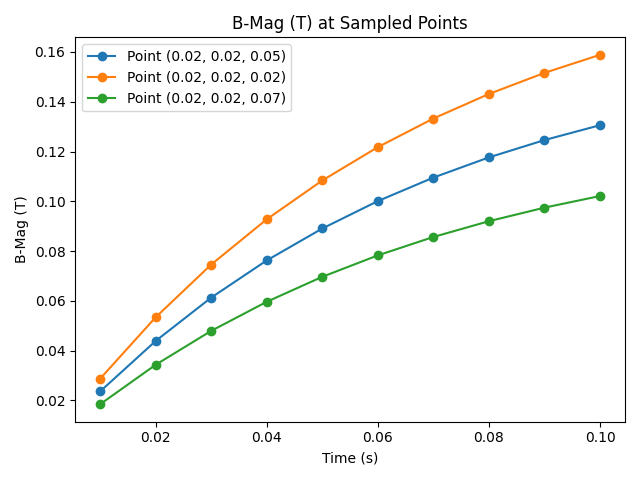
data = plt.sample_points([(0.02, 0.02, 0.05), (0.02, 0.02, 0.02), (0.02, 0.02, 0.07)])
fig, ax = pyplot.subplots()
ax.plot(data[0]["B-Mag (T)"]["time"], data[0]["B-Mag (T)"]["value"], marker="o", label="Point (0.02, 0.02, 0.05)")
ax.plot(data[1]["B-Mag (T)"]["time"], data[1]["B-Mag (T)"]["value"], marker="o", label="Point (0.02, 0.02, 0.02)")
ax.plot(data[2]["B-Mag (T)"]["time"], data[2]["B-Mag (T)"]["value"], marker="o", label="Point (0.02, 0.02, 0.07)")
ax.set_xlabel("Time (s)")
ax.set_ylabel("B-Mag (T)")
ax.set_title("B-Mag (T) at Sampled Points")
ax.legend()
fig.tight_layout()
fig.savefig("docs/static/demos/sample_points.png")
Query a single time value
from pyemsi import Plotter, examples

file_path = examples.transient_path()
plt = Plotter(file_path)

# Use time_point_value() to look up the time value for a given index
t = plt.time_point_value(4)   # 0.05  (5th time step, zero-based)

# Sample only at that time value instead of sweeping all time steps
data = plt.sample_points([(0.02, 0.02, 0.05), (0.02, 0.02, 0.02), (0.02, 0.02, 0.07)], time_value=t)

print(data[0]["B-Mag (T)"]["time"])   # [0.05]
print(data[0]["B-Mag (T)"]["value"])  # [0.08909410238265991]
print(data[1]["B-Mag (T)"]["value"])  # [0.10839000344276428]
print(data[2]["B-Mag (T)"]["value"])  # [0.06968670338392258]
See Also
sample_point()— Sample at a single point coordinatesample_line()— Sample along a straight linequery_points()— Query data by point IDs (indexed access)